9.9. Subsectors in MUSE
In a previous tutorial (“Adding a service demand”) we added technologies to the residential sector to service an additional demand for cooking. In this tutorial, we will use this model to explore a feature of MUSE that we haven’t touched on yet: subsectors
All sectors in MUSE have at least one subsector. For simple sectors servicing a single commodity demand, one subsector is all we need. For example, a power sector servicing just electricity would contain a single subsector (in previous tutorials we would have called this subsector all). Within the sector, MUSE will then set up a single optimization problem to meet electricity demands by investing among a set of electricity-producing technologies.
However, in the “Adding a service demand” tutorial, we created a residential sector that produces two demanded commodities: cook and heat.
This is still possible with a single subsector (as we saw in that tutorial). In this case, MUSE sets up a single optimization problem to meet both heat and cook demands by investing among a set of heat-producing and cook-producing technologies.
However, given that heat and cook are serviced by entirely independent sets of technologies, we could alternatively set up two distinct optimization problems: one to service heat demands by investing in heat-producting technologies, and another the service cook demands by investing in cook-producing technologies.
This can be done by splitting the sector into multiple sectors, which will become clearer as we progress with this tutorial.
There are several benefits of doing this. The first is computational, as MUSE now has to solve two simpler optimization problems rather than one larger, more complicated one. For this small example there may be no benefit of this (or the added overhead may outway the gains), but for larger sectors the gains can be substantial (particularly when the sector gets so large that the full linear problem cannot fit within the memory of your machine).
The second benefit it that it allows you to specify different agent characteristics/objectives for servicing each commodity. For example, you may wish agents to minimise LCOE when investing in heating technologies, but minimise fuel consumption costs when investing in cooking technologies. We will explore this scenario below.
9.9.1. Splitting a sector into subsectors
Note: This tutorial starts off from the model produced in the “Adding a service demand” tutorial. If you haven’t done so already, please complete that tutorial and save the model input files before coming back to this tutorial
You will see in the settings file that we currently have a single subsector in the residential sector
[sectors.residential.subsectors.all]
agents = '{path}/Agents.csv'
existing_capacity = '{path}/residential/ExistingCapacity.csv'
If we look at the technologies in the sector, we can clearly put them into two groups: gasboiler and heatpump service heat, whereas electric_stove and gas_stove service cook.
The first step for splitting a sector into multiple subsectors is to identify the technologies that service each commodity, and split up the existing capacity file along these lines. Currently, our existing capacity file looks as follows:
technology |
region |
2020 |
2025 |
2030 |
2035 |
2040 |
2045 |
2050 |
|---|---|---|---|---|---|---|---|---|
gasboiler |
R1 |
10 |
5 |
0 |
0 |
0 |
0 |
0 |
heatpump |
R1 |
0 |
0 |
0 |
0 |
0 |
0 |
0 |
electric_stove |
R1 |
0 |
0 |
0 |
0 |
0 |
0 |
0 |
gas_stove |
R1 |
10 |
5 |
0 |
0 |
0 |
0 |
0 |
We can split this into two files, one for the heating technologies:
technology |
region |
2020 |
2025 |
2030 |
2035 |
2040 |
2045 |
2050 |
|---|---|---|---|---|---|---|---|---|
gasboiler |
R1 |
10 |
5 |
0 |
0 |
0 |
0 |
0 |
heatpump |
R1 |
0 |
0 |
0 |
0 |
0 |
0 |
0 |
and one for the cooking technologies:
technology |
region |
2020 |
2025 |
2030 |
2035 |
2040 |
2045 |
2050 |
|---|---|---|---|---|---|---|---|---|
electric_stove |
R1 |
0 |
0 |
0 |
0 |
0 |
0 |
0 |
gas_stove |
R1 |
10 |
5 |
0 |
0 |
0 |
0 |
0 |
If you save these as ExistingCapacityHeat.csv and ExistingCapacityCook.csv, you can then create two subsectors in the settings file as follows (replacing the previous all subsector):
[sectors.residential.subsectors.heat]
agents = '{path}/Agents.csv'
existing_capacity = '{path}/residential/ExistingCapacityHeat.csv'
commodities = ["heat"]
[sectors.residential.subsectors.cook]
agents = '{path}/Agents.csv'
existing_capacity = '{path}/residential/ExistingCapacityCook.csv'
commodities = ["cook"]
Leave the agents field as it is for now, but we will change this later.
Note: It’s helpful to explicitly state the end-use commodity/commodities in the subsector, but if these are omitted MUSE can figure this out based on the technologies that you put in the existing capacity files.
We can now run the model and look at the results:
[1]:
import matplotlib.pyplot as plt
import pandas as pd

mca_capacity = pd.read_csv(
    "../tutorial-code/add-service-demand-subsectors/1-residential-subsectors/Results/MCACapacity.csv"
)

fig, axes = plt.subplots(1, 3)
all_years = mca_capacity["year"].unique()
for ax, (sector_name, sector_data) in zip(axes, mca_capacity.groupby("sector")):
    sector_capacity = sector_data.groupby(["year", "technology"]).sum().reset_index()
    sector_capacity.pivot(
        index="year", columns="technology", values="capacity"
    ).reindex(all_years).plot(kind="bar", stacked=True, ax=ax)
    ax.set_ylabel("Capacity (PJ)")
    ax.set_xlabel("Year")
    ax.set_title(f"{sector_name.capitalize()} Sector:", fontsize=10)
    ax.legend(title=None, prop={"size": 8})
    ax.tick_params(axis="both", labelsize=8)

fig.set_size_inches(8, 2.5)
fig.subplots_adjust(wspace=0.5)
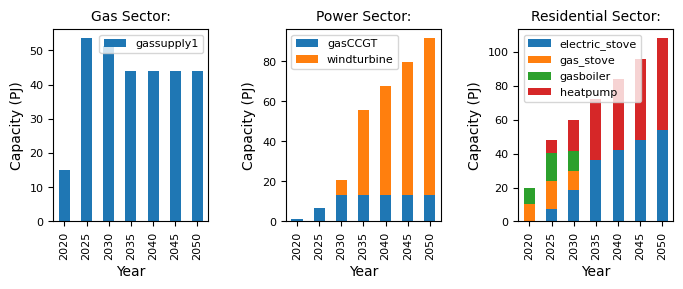
You should see that the results are exactly as they were in the previous tutorial. This is a good control, and allows us to move onto the next scenario, where we consider different agent characteristics for each service demand.
9.9.2. Subsector-level agents
So far, in all tutorials, we have relied on a single agents configuration in all sectors. However, it’s possible to specify unique agents at the subsector level. To do this, we must create separate agents files that we link to within each subsector.
Start off by copying the existing agents file to create two new files within the residential folder: AgentsHeat.csv and AgentsCook.csv. Then link to these from the settings file as follows:
[sectors.residential.subsectors.heat]
agents = '{path}/residential/AgentsHeat.csv'
existing_capacity = '{path}/residential/ExistingCapacityHeat.csv'
commodities = ["heat"]
[sectors.residential.subsectors.cook]
agents = '{path}/residential/AgentsCook.csv'
existing_capacity = '{path}/residential/ExistingCapacityCook.csv'
commodities = ["cook"]
Note: It’s up to you how you organise your files, as long as you reference them properly in the settings file (for example, you may wish to create separate folders for each subsector).
We can now modify these files to specify different agent configurations within each subsector. To demonstrate this, open up the AgentsCook.csv file and change the objective from LCOE to fuel_consumption_cost. Now we can run the model again and compare the results:
[2]:
mca_capacity = pd.read_csv(
    "../tutorial-code/add-service-demand-subsectors/2-agents/Results/MCACapacity.csv"
)

fig, axes = plt.subplots(1, 3)
all_years = mca_capacity["year"].unique()
for ax, (sector_name, sector_data) in zip(axes, mca_capacity.groupby("sector")):
    sector_capacity = sector_data.groupby(["year", "technology"]).sum().reset_index()
    sector_capacity.pivot(
        index="year", columns="technology", values="capacity"
    ).reindex(all_years).plot(kind="bar", stacked=True, ax=ax)
    ax.set_ylabel("Capacity (PJ)")
    ax.set_xlabel("Year")
    ax.set_title(f"{sector_name.capitalize()} Sector:", fontsize=10)
    ax.legend(title=None, prop={"size": 8})
    ax.tick_params(axis="both", labelsize=8)

fig.set_size_inches(8, 2.5)
fig.subplots_adjust(wspace=0.5)
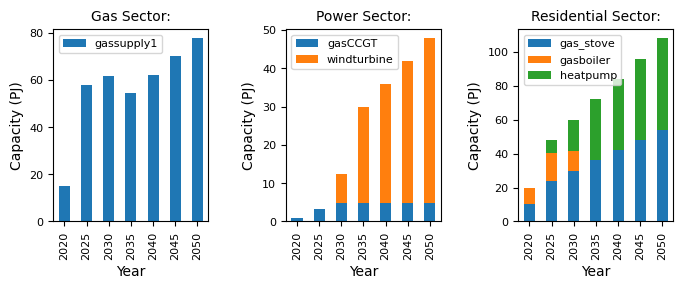
You should see that investment decisions for heating technologies (gasboiler and heatpump) are exactly the same as before, but a new scenario emerges for cooking technologies with a strong preference for gas_stove over electric_stove. This also has consequences for the gas and power sectors, which adapt to meet the shifting demands for gas and electricity (i.e. higher gas demand and lower electricity demand compared to the previous scenario).
9.9.3. Summary
In this tutorial we have shown how to split a sector into multiple subsectors. In general, this is possible if the sector services multiple end-use commodities, and there are distinct groups of technologies that service each of these commodities.
This will not always be the case. For example, if there was a technology that serviced both heat and cook (such as an AGA), it wouldn’t be possible to split up the sector in this way.
You are encouraged to think about this for your own models, and carefully consider whether each sector can be split up into multiple subsectors. Not only is there a potential computational benefit of doing so, but this also allows us to explore new scenarios by setting different agent properties in each subsector. We’ve shown an example here involving agent objectives, but you could also modify the search space, decision rule, or even the relative demand shares of agents in multi-agent simulations (as represented by the “Quantity” column).